Direct Standardization Demo
The point of this demo is to basically show off that ChemometricsTools contains some base methods for Calibration Transfer. If you don't know what that is, it's basically the subset of Chemometrics that focuses on transfer learning data collected on one instrument to another. This saves time and money for instruments that need to be calibrated but perform routine analysis'.
This demo uses the 2002 pharmaceutical shoot-out data and predicts upon the first property value(pretty sure its API content). The dataset contains the same samples of an unstated pharmaceutical measured on two spectrometers with experimentally determined property values. Our goal will be to use one model but adapt the domain from one of the spectrometers to the other.
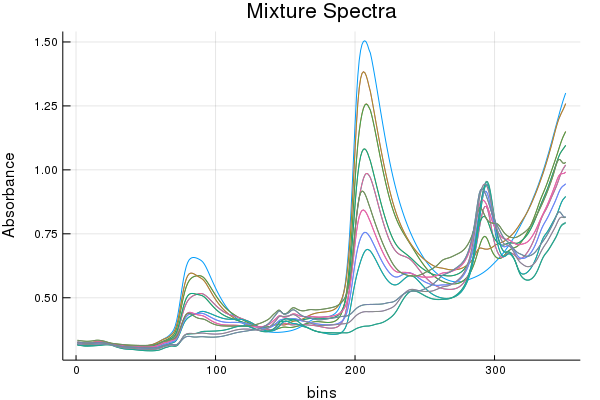
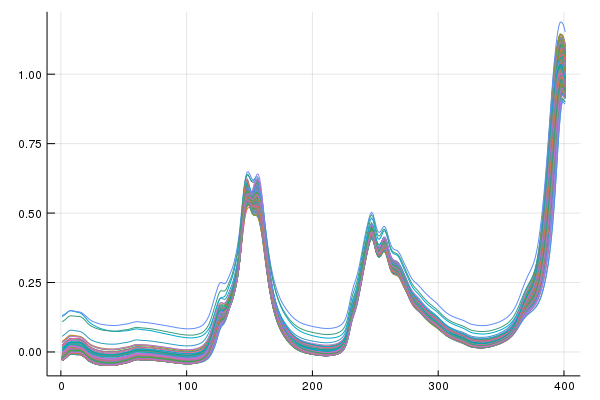
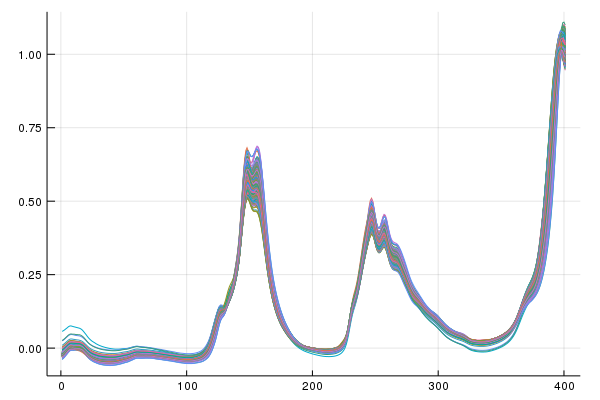
First let's look at our linear sources of variation to get a feel for the data,
pca = PCA(calib1; Factors = 20);
plot(cumsum(ExplainedVariance(pca)), title = "Scree plot", xlabel = "PC's", ylabel = "Variance Explained")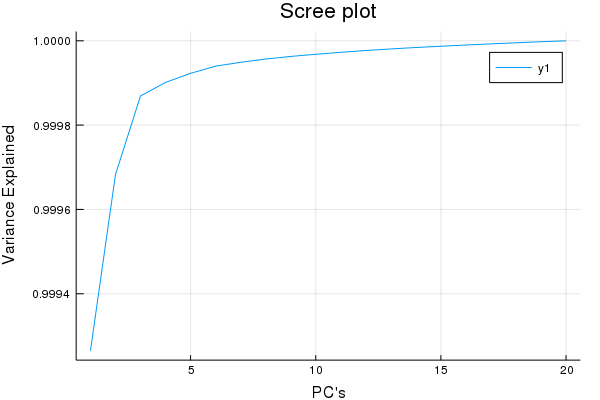
Yea so this isn't a true Scree plot, but it has the same information...
Looks like after ~5 factors we have garbage w.r.t X decompositions, good to know. So I'd venture to guess a maximum of 15 Latent Variables for a PLS-1 regression is more than a good enough cut-off for cross-validaiton.
MaxLvs = 15
Err = repeat([0.0], MaxLvs);
Models = []
for Lv in MaxLvs:-1:1
for ( i, ( Fold, HoldOut ) ) in enumerate(KFoldsValidation(10, calib1, caliby))
if Lv == MaxLvs
push!( Models, PartialLeastSquares(Fold[1], Fold[2]; Factors = Lv) )
end
Err[Lv] += SSE( Models[i]( HoldOut[1]; Factors = Lv), HoldOut[2] )
end
end
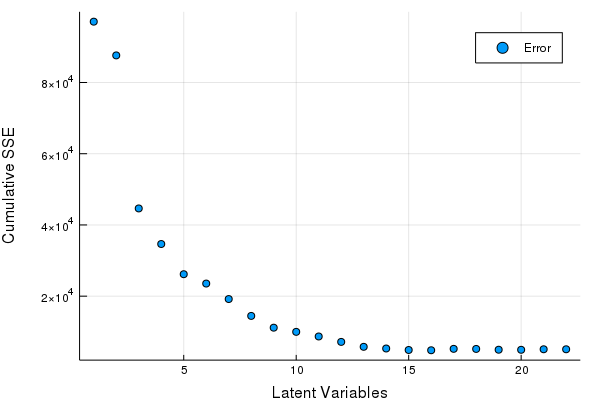
scatter(Err, xlabel = "Latent Variables", ylabel = "Cumulative SSE", labels = ["Error"])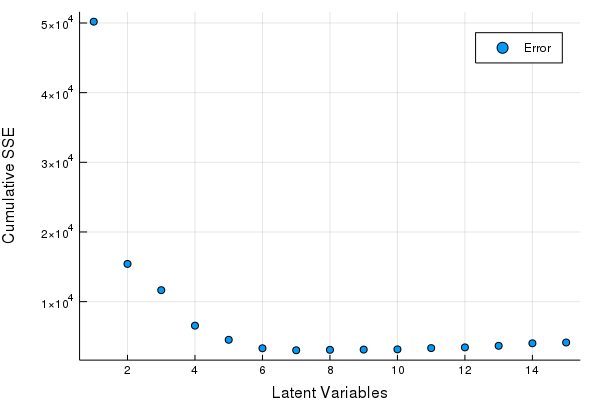
Great looks like we can get by with 5-8 LV's. Let's fine tune our Latent Variables based on the hold out set to make our final PLSR model.
PLSR1 = PartialLeastSquares(calib1, caliby; Factors = 8);
for vLv in 5:8
println("LV: ", vLv)
println("RMSEV: ", RMSE(PLSR1(valid1; Factors = vLv), validy))
endKind of hacky, but it works fine for a demo, we see that 7 factors is optimal on the hold out set so that's what we'll use from here on,
println("RMSEP: ", RMSE(PLSR1(tst1; Factors = 7), tsty))> RMSEP: 4.76860402876937
Getting to the point
So why do we need to do a calibration transfer? Same chemical, same type of measurements, even the same wavelengths are recorded and compared. Do the naive thing, apply this model to the measurements on instrument 2. See what error you get.
println("RMSEP: ", RMSE(PLSR1(tst2; Factors = 7), tsty))>RMSEP: 10.303430504546292
The prediction error is about 2 fold, in this case it'd be hard to argue this is a useful model at all. Especially if you check the residuals. It's pretty clear the contributions of variance across multiple instruments are not the same in this case.
Now for calibration transfer!
So let's use DirectStandardization. First we'll find the optimal number of DirectStandardization Factors to include in our model. We can do that on our hold out set and this should be very fast because we have a hold out set, so we can do this with some inefficient code.
Factors = 1:15
Err = repeat([0.0], length(Factors));
for F in Factors
DS2to1 = DirectStandardization(calib1, calib2; Factors = F);
cds2to1 = DS2to1(valid2; Factors = F)
Err[F] = RMSE( PLSR1(cds2to1; Factors = 7), validy )
end
scatter(Err, title = "Transfered Model Validation Error", xlabel = "Latent Factors",
ylabel = "RMSE", labels = ["Error"])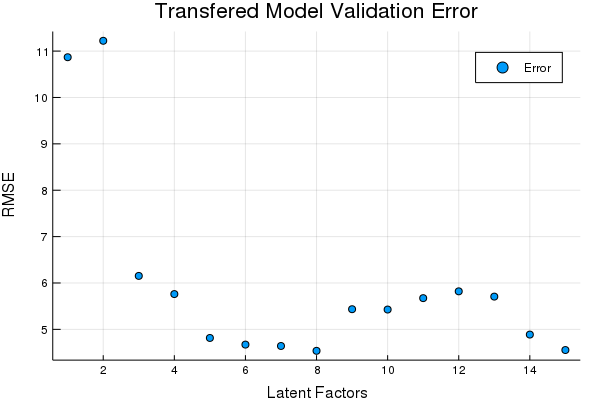
OptimalDSFactor = argmin(Err)
DS2to1 = DirectStandardization(calib1, calib2; Factors = OptimalDSFactor);
tds2to1 = DS2to1(tst2; Factors = OptimalDSFactor);Looks like 8 Factors in the DS transfer is pretty good. Lets see how the transferred data compares on the prediction set using the same model,
println("RMSEP: ", RMSE(PLSR1(tds2to1; Factors = 7), tsty))> RMSEP: 5.693023386113084
Viola... So in conclusion we can transform the data from instrument 2 to be similar to that of instrument 1. The errors we see are effectively commensurate between the data sources with this transform, and without it the error is about 2x greater. Maybe the main point here is "look ChemometricsTools has some calibration transfer methods and the tools included work". OSC, TOP, CORAL, etc is also included.